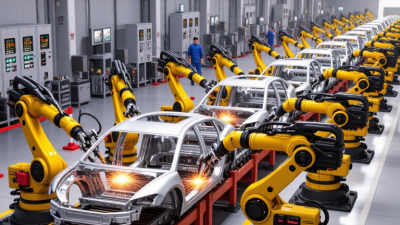
China Top 10 Industrial Process Automation Suppliers

China’s industrial process automation market is changing quickly. Factories now connect sensors, controllers, drives, robots, and production software across one operating environment. This shift makes supplier selection more demanding than comparing product catalogs.

Odo Struger, widely recognized as the father of the programmable logic controller, once described the PLC as “the most significant invention in industrial control in the last 50 years.” His observation still matters on today’s factory floor. A control cabinet may contain hundreds of signal points, while a single valve can affect safety, quality, energy use, and output. Reliable automation must therefore combine engineering depth with practical support.

This guide examines China’s top 10 industrial process automation suppliers through several useful lenses. These include product capability, system integration, industry experience, local service, software development, and long-term reliability. It considers suppliers serving chemical plants, oil and gas facilities, power stations, water treatment sites, food factories, and advanced manufacturing lines.

A polished website proves little. Field performance matters more.

The strongest companies usually provide clear documentation, responsive commissioning teams, spare-parts planning, and realistic lifecycle costs. They also understand communication protocols, cybersecurity responsibilities, regulatory expectations, and operator training. Still, no ranking is perfect. A supplier may appear strong in one sector but lack experience in another. Pricing can also hide maintenance demands, integration delays, or difficult upgrades.

Readers should treat this list as a practical starting point, not a final verdict. Site conditions, production risks, budget limits, and future expansion plans must shape the final decision. That is where careful review becomes essential.
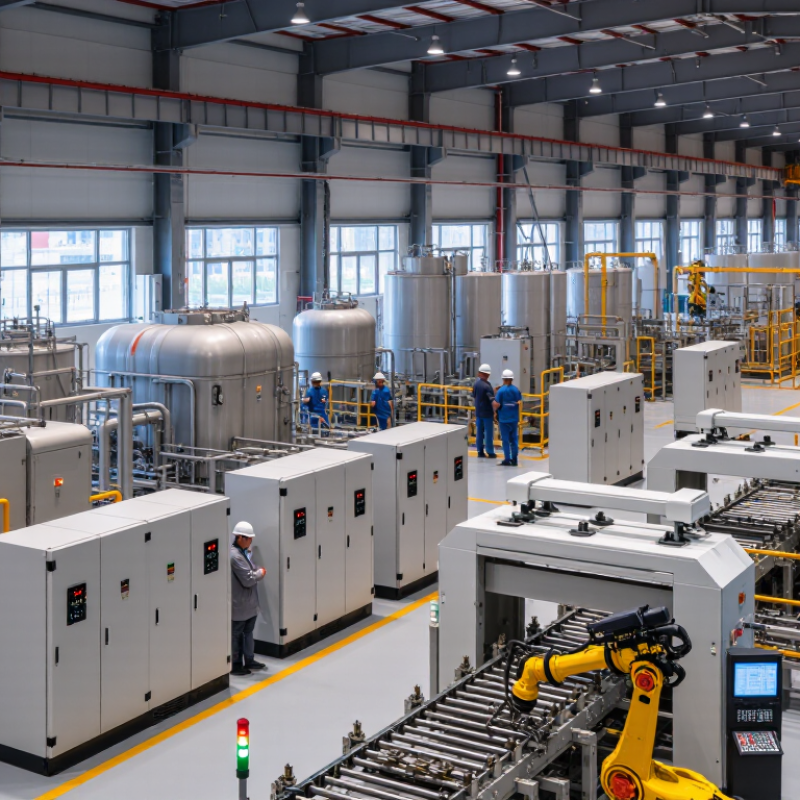
China Top 10 Industrial Process Automation Suppliers

China’s Industrial Automation Market: 2023 Metrics from MIR DATABANK and IFR

China’s industrial automation market remained large in 2023, despite slower factory investment. MIR DATABANK’s tracking placed the market at approximately RMB 290 billion. Growth was modest rather than explosive. Demand came from automotive equipment, electronics, batteries, logistics, and general machinery. Many factories upgraded control systems in small stages, replacing aging components during scheduled maintenance.

IFR recorded 276,288 industrial robot installations in China during 2023. This represented about 51% of global installations, although the figure declined by roughly 5% year on year. China’s operational robot stock reached approximately 1.75 million units, continuing its long-term rise. These numbers show strong installed capacity, but they do not prove that every factory is highly automated. Some production lines still depend on manual loading, visual inspection, and repeated adjustment.

The two data sources measure different parts of the market. MIR DATABANK covers broader automation equipment and systems, while IFR focuses on industrial robots. Direct comparison can therefore mislead. That limitation matters. From a supplier evaluation perspective, buyers should examine local service teams, spare-parts response, software compatibility, safety certification, and commissioning records. A lower purchase price may look attractive, but downtime beside a packaging line can erase the saving quickly. China’s supplier landscape is expanding, yet consistency across regions remains an issue. Even experienced buyers should verify performance through site visits and documented production data.

Ranking Criteria for the Top 10: Revenue, R&D, Installed Base, and CSIA

China Top 10 Industrial Process Automation Suppliers

Revenue provides the first measurable signal of market strength, but it should not decide the ranking alone. We assess recent revenue, automation-related share, year-on-year stability, and disclosed project sources. Audited reports and consistent filings receive greater weight than promotional estimates. Numbers need context.

R&D shows whether a supplier can solve difficult plant problems. We examine engineering staff, software updates, control platforms, cybersecurity testing, and laboratory investment. A large budget is not automatically effective. Field evidence matters. Installed base adds that evidence. We review operating systems, production sites, service records, and replacement cycles. Verified installations across chemicals, energy, food, and manufacturing indicate practical experience. A company with fewer installations may still deserve consideration if its systems operate reliably in demanding environments.

CSIA-related recognition supports the professional and industry credibility of each candidate. We consider eligible membership, technical participation, published standards work, training activity, and documented industry awards. These indicators cannot replace technical proof. They can, however, reveal whether a supplier contributes beyond sales. Scoring should also reflect service response, spare-parts access, commissioning quality, and customer references. Data gaps remain a weakness. Some suppliers disclose revenue clearly but provide limited installed-base details; others report impressive project counts without independent verification. A transparent ranking should mark those limitations rather than hide them.

China Top 10 Industrial Process Automation Suppliers — Ranking Criteria

This editorial scoring model evaluates industrial process automation suppliers using four measurable dimensions: revenue reflects commercial scale, R&D reflects innovation investment, installed base reflects market adoption and delivery experience, and CSIA reflects alignment with recognized system-integration industry standards. The percentages represent the proposed ranking weights rather than company-specific results.

Top 10 Supplier Profiles: PLC, DCS, SCADA, MES, and Drive Technologies

China’s top industrial process automation suppliers cover five essential technology areas: PLC, DCS, SCADA, MES, and industrial drives.

Their strengths differ by application, scale, and integration depth. A PLC supplier may excel in fast machine control, while a DCS supplier often supports continuous production and distributed safety functions. SCADA platforms provide visual monitoring, alarms, historian tools, and remote access. MES solutions connect production data with scheduling, quality records, and traceability. Drive specialists focus on stable motor speed, torque, and energy control.

A useful supplier profile should examine engineering experience, protocol support, cybersecurity practices, lifecycle service, and commissioning capability.

Ask how the system performs in a noisy plant environment. Check sample alarm screens and cabinet layouts. Request evidence from comparable industries. Price alone can mislead. A low initial quote may hide training, spare parts, or integration costs. Supplier rankings also change by region and project type. That is worth remembering.

Tips:

Build a short test project before full deployment. Connect one production line first. Measure response time, data accuracy, alarm quality, and operator training needs. Keep critical control functions local when network interruptions are possible. Review five-year maintenance costs, not only purchase prices. Leave room for improvement. Real factories rarely match the original design perfectly.

China’s 51% Share of Global Robot Installations in 2023: Sector Impact

China’s 51% share of global robot installations in 2023 reshaped industrial process automation. The International Federation of Robotics reported 276,288 new industrial robots installed across Chinese factories. This figure exceeded every other national market. It also exposed a practical shift. Automation is moving from isolated machines toward connected production cells.

The same IFR report recorded China’s robot density at 470 units per 10,000 manufacturing employees in 2023. The global average was 162. Suppliers must now provide more than robotic arms. They need motion control, machine vision, safety systems, industrial software, and responsive maintenance. In real plants, a failed sensor can stop an entire packaging line within minutes. Reliable integration matters as much as equipment speed.

However, installation volume does not guarantee equal productivity. Some factories still struggle with operator training, data quality, and compatibility between older equipment and new systems. That gap deserves more attention. The China Robot Industry Alliance has also identified strong demand from automotive, electronics, metal processing, and logistics applications. For the top industrial automation suppliers, local engineering support may become a decisive advantage. Hardware looks impressive. Deployment discipline is harder.

China Top 10 Industrial Process Automation Suppliers - China’s 51% Share of Global Robot Installations in 2023: Sector Impact

No. Data Dimension 2023 Indicator Measured Value Sector Impact Source
1 Global industrial robot installations Annual installations worldwide 541,302 units Defines the addressable global market for robotics, controls, motion systems, and integration services. International Federation of Robotics, World Robotics 2024
2 China’s share of global installations New industrial robots installed in China 276,288 units; approximately 51% China remained the largest national market, increasing demand for localized automation supply chains. International Federation of Robotics, World Robotics 2024
3 Year-on-year installation growth China, 2023 versus 2022 Approximately +5% Shows continued investment momentum despite slower growth in some manufacturing segments. International Federation of Robotics, World Robotics 2024
4 Operational industrial robot stock Installed base operating in China at year-end Approximately 1.755 million units Creates recurring demand for maintenance, spare parts, software upgrades, safety systems, and lifecycle services. International Federation of Robotics, World Robotics 2024
5 Global operational robot stock Installed base operating worldwide at year-end Approximately 4.282 million units Places China’s installed base at roughly 41% of the global operational stock. International Federation of Robotics, World Robotics 2024
6 Robot density in manufacturing Industrial robots per 10,000 manufacturing employees 470 robots Indicates significant automation penetration while leaving room for further modernization across factories. International Federation of Robotics, World Robotics 2024
7 Domestic supplier market share Share of China’s domestic robot installations supplied by Chinese manufacturers Approximately 47% Reflects increasing opportunities for local suppliers in robot hardware, control systems, components, and integration. International Federation of Robotics, World Robotics 2024
8 Manufacturing value added China’s manufacturing value added in current U.S. dollars Approximately US$4.66 trillion Provides a large industrial customer base for process control, factory software, robotics, and production equipment. World Bank national accounts data, 2023
9 Core automation demand areas High-investment industrial applications Automotive, electronics, metalworking, logistics, and general manufacturing Supports demand for assembly, welding, packaging, machine tending, inspection, warehouse automation, and digital production systems. International Federation of Robotics, World Robotics 2024
10 Supplier capability priorities Capabilities required by Chinese industrial customers Integrated hardware, software, services, and local support Competitive advantage increasingly depends on system integration, interoperability, predictive maintenance, energy efficiency, and fast regional service. Industry trend synthesis based on IFR robotics market data and China manufacturing policy priorities

Note: Robot installation figures refer to industrial robots recorded by the International Federation of Robotics. Percentages are rounded; the 51% share is calculated from China’s approximately 276,288 installations compared with approximately 541,302 installations worldwide in 2023.

Supplier Comparison: Market Coverage, Certifications, Projects, and Service Data

China Top 10 Industrial Process Automation Suppliers

A reliable comparison should examine more than product catalogs or sales claims. Review market coverage across chemicals, power, water treatment, food processing, and discrete manufacturing. Check whether suppliers support national projects, export installations, and remote sites. Certifications such as ISO 9001, ISO 14001, IEC 61508, and IEC 62443 can indicate disciplined quality and safety processes. However, certificates alone do not prove field performance.

Tips: Request three recent project references with similar production conditions. Ask for commissioning records, response-time data, spare-parts locations, and engineer qualifications. Service coverage matters when a control system stops at 2 a.m. A supplier may promise fast support, yet provide no measurable service-level agreement. That gap deserves attention.

Project evidence should include system size, delivery period, uptime targets, integration scope, and post-installation results. Compare training hours, warranty terms, software updates, and local technical teams. Some suppliers show impressive market coverage but rely heavily on subcontractors. That is not automatically negative, but responsibilities must be written clearly. I would also inspect cybersecurity procedures and change-control records. Public information is often incomplete, so rankings can become subjective. A careful buyer should record evidence, note missing data, and avoid treating a polished case study as independent proof.

×
img

    Contact Info

    PHONE NUMBER

    +1 (619) 661-5985

    EMAIL ADDRESS

    sale@roboticemotion.com

    ADDRESS INFO

    10030 Via de la Amistad San Diego CA 92154, United States